Appearance
Exporting raw analytics data
Ease Live Analytics empowers customers to extract valuable insights from their data effortlessly. Through intuitive visualizations and advanced reporting, customers can identify and track key data points to grow their business and increase the revenues.
Key benefits
- First Party Data Collection – Helps customers to collect clean first party data for their Customer Data Platform (CDP).
- Time Of Peak Interactions - By identfying the reasons for top users engagement at a particular time, customers can apply that strategy at different places.
- Platforms Used During Peak Interactions - By identifying the device os being used during different 5 minutes time interval, customers can aim for better sponsorship deals and ad targets.
- Unified Analytics Dashboard – Helps customer to monitor all the different interactions in a programs.
- Business Insights – Visualizations are created with meaningful filters for users and programs analytics.
Flow diagram
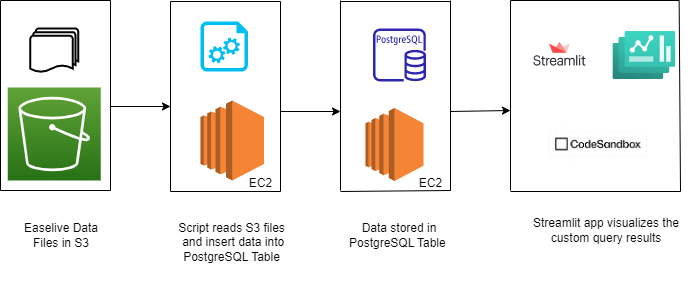
Script for data ingestion
This sample python code is written for as a proof of concept to explain how you could ingest data from our S3 storage into your own data warehouse.
Importing required libraries
python
import os
import json
from datetime import datetime
import psycopg2
import boto3
import sys
import pytz
import time
Assigning global variables
python
db_host = os.getenv('DB_HOST', '<DB_HOST>')
db_port = os.getenv('DB_PORT', '<DB_PORT>')
db_username = os.getenv('DB_USERNAME', '<DB_USERNAME>')
db_password = os.getenv('DB_PASSWORD', '<DB_PASSWORD>')
database_name = os.getenv('DATABASE_NAME', '<DATABASE_NAME>')
database_schema = os.getenv('DATABASE_SCHEMA', '<DATABASE_SCHEMA>')
Minimum columns required in database table for analytics
python
column_names = ['account_id', 'user_id', 'program_id', 'project_id', 'session_id',
                'version', 'stream_id', 'device_type', 'device_os', 'player_time', 'measurename',
                'measurevalue', 'measurevaluetype', 'time', 'timeunit', 'context_id', 'response_id', 'converted_time']
Read content of a single S3 file
python
def process_json_data(data):
    objects = data.strip().splitlines()
    parsed_objects = []
    for obj_str in objects:
        obj = json.loads(obj_str)
        parsed_objects.append(obj)
    #print(parsed_objects)
    return parsed_objects
Setup database connection
This example uses PostgreSQL, but you can use whatever you'd like.
python
def connect_to_database():
    conn = psycopg2.connect(
        host=db_host,
        port=db_port,
        user=db_username,
        password=db_password,
        database=database_name,
        options="-c search_path=dbo,"+database_schema
    )
    return conn
Insert contents of a single S3 file to database target table
python
def insert_data_to_database(parsed_objects, conn):
    cur = conn.cursor()
    try:
        # iterating the contents of a single s3 file line by line
        for obj in parsed_objects:
            # checking available column values in each line of a single S3 file
            account_id = obj.get('account_id') if obj.get('account_id') else "null"
            user_id = obj.get('user_id') if obj.get('user_id') else "null"
            program_id = obj.get('program_id') if obj.get('program_id') else "null"
            project_id = obj.get('project_id') if obj.get('project_id') else "null"
            session_id = obj.get('session_id') if obj.get('session_id') else "null"
            version  = obj.get('version') if obj.get('version') else "null"
            stream_id = obj.get('stream_id') if obj.get('stream_id') else "null"
            device_type = obj.get('device_type') if obj.get('device_type') else "null"
            device_os = obj.get('device_os') if obj.get('device_os') else "null"
            player_time = obj.get('player_time') if obj.get('player_time') else "null"
            measurename = obj.get('MeasureName') if obj.get('MeasureName') else "null"
            measurevalue = obj.get('MeasureValue') if obj.get('MeasureValue') else "null"
            measurevaluetype = obj.get('MeasureValueType') if obj.get('MeasureValueType') else "null"
            time = obj.get('Time') if obj.get('Time') else "null"
            timeunit = obj.get('TimeUnit') if obj.get('TimeUnit') else "null"
            context_id =  obj.get('context_id') if obj.get('context_id') else "null"
            response_id = obj.get('response_id') if obj.get('response_id') else "null"
            converted_time  = obj.get('converted_time') if obj.get('converted_time') else "null"

            # inserting a single row into the target table
            query_text = "INSERT INTO <table_name> (" + ', '.join(column_names) + ") VALUES (" + ','.join(["%s"] * len(column_names)) + ")"
            cur.execute(query_text,tuple([account_id, user_id, program_id, project_id, session_id, version, stream_id, device_type, device_os, player_time, measurename, measurevalue, measurevaluetype, time, timeunit, context_id, response_id, converted_time]))

        # commiting to database after reading all the lines in a single S3 file
        conn.commit()
    except Exception as e:
        print("Error occurred while inserting data into the database:", e)

    finally:
        cur.close()
        conn.close()
Main function
python
def main():
    start = time.time()
    print("script execution start_time: ", start)
    s3_bucket_name='<s3_bucket_name>'

    # Code to access S3 path for the given programid
    s3 = boto3.resource('s3',aws_access_key_id= '<s3_access_key>',aws_secret_access_key='<s3_secret_key>')
    bucket_list = []
    s3_bucket = s3.Bucket(s3_bucket_name);

    # Code to read all file names in the S3 path
    for files in s3_bucket.objects.filter(Prefix='<account_id>/<project_id>/<program_id>/',Delimiter='/'):
        filename = files.key
        bucket_list.append(filename)

    # Code to read all file content in the S3 path
    for file_key in bucket_list:
        s3_object = s3.Object(bucket_name=s3_bucket_name, key=file_key)
        s3_response = s3_object.get()
        response = s3_response.get('Body')
        data = response.read().decode('utf-8')

        parsed_objects = process_json_data(data)

        # creating db connection to insert the contents of a single S3 file in each iteration
        conn = connect_to_database()
        try:
            for obj in parsed_objects:
                if 'Time' in obj and obj['Time'] is not None:
                    try:
                        # creating an additional column by converting the EPOCH values in 'Time' to a UTC timestamp format
                        unix_timestamp_milliseconds = int(obj['Time'])
                        utc_time = datetime.fromtimestamp(unix_timestamp_milliseconds // 1000, tz=pytz.utc)
                        time_in_datetime = utc_time.strftime('%Y-%m-%d %H:%M:%S')
                        obj['converted_time'] = time_in_datetime
                    except ValueError as e:
                        print(f"Invalid Time value: {obj['Time']}, Error: {e}")
                        continue

            insert_data_to_database(parsed_objects, conn)

        except Exception as e:
            print(f"Error occurred while processing file : {e}")
            continue
        finally:
            conn.close()

    end = time.time()
    print("script execution end_time: ", end)
    #Subtract Start Time from The End Time
    total_time = end - start
    print("\n"+ str(total_time))


if __name__ == "__main__":
    main()
Example reports
Top 25 users with most interactions
In this visualization, we displayed the users with most interactions and their counts for a particular program in the easelive platform.This interactive bar graph showcases the individuals who are driving the highest number of interactions.
python
import streamlit as st
import pandas as pd
import plotly.express as px

df = pd.read_csv("Top_Users_Easelive_interactions.csv")

st.header("Top 25 Users With Most Interactions")
count = st.slider("Top Users", 0, 25, value=10)
data_frame = df.head(count)
fig = px.bar(data_frame, x="user_id",
             y="total_interaction_count", color="user_id")
fig.update_xaxes(title_text="User ID", title_font=dict(
    size=14, family='Courier', color='Blue'))
fig.update_yaxes(title_text="Total Interactions", title_font=dict(
    size=14, family='Courier', color='Blue'))
st.plotly_chart(fig)User interaction at 5 minutes interval
The visualization shows how users engagement evolves over the course of a program by breaking down into 5-minute intervals. This interactive bar graph illustrates the fluctuating number of user's interaction at different 5 minutes time interval, helping us to understand when there is peak engagement and when it's relatively less.
python
import streamlit as st
import pandas as pd
import plotly.express as px

df = pd.read_csv("5-mins-bin.csv")
tf_dict = dict(size=14, family='Courier', color='Blue')
st.header("Users Interactions At 5 Minutes Interval")
fig = px.bar(df, x="bin_time", y="user_count")
fig.update_xaxes(title_text="Time", title_font=tf_dict)
fig.update_yaxes(title_text="Users Count", title_font=tf_dict)
st.plotly_chart(fig)User interaction at 5 minutes interval by device OS
The visualization offers insights on the different device OS being used to make interactions on the platform in each 5 minutes interval during the game.
python
import streamlit as st
import pandas as pd
import plotly.graph_objs as go
df = pd.read_csv("5-mins-bin-deviceos.csv")
st.header("Users Interactions At 5 Minutes Interval By Device OS")
df['Time'] = df['bin_start_time'].astype(str)
grouped_data = df.groupby(['device_os', 'bin_start_time'])[
    'user_count'].sum().unstack()
fig = go.Figure()
for time_interval in grouped_data.index:
    fig.add_trace(go.Bar(x=grouped_data.columns,
                  y=grouped_data.loc[time_interval], name=time_interval))
fig.update_layout(barmode='stack', xaxis_title='Time',
                  yaxis_title='Users Count by Device OS')
fig.update_xaxes(title_text="Time", title_font=dict(
    size=14, family='Courier', color='Blue'))
fig.update_yaxes(title_text="Users Count by Device OS",
                 title_font=dict(size=14, family='Courier', color='Blue'))
st.plotly_chart(fig)Users with maximum trivia questions answered
The visualization offers insights about users engagement on trivia questions for a program. We included the trivia questions answered by the users (in multiple sessions) also to gauge the success of the trivia content and its impact on user engagement.
python
import streamlit as st
import pandas as pd
import plotly.express as px

df = pd.read_csv("Top_Users_Trivia_Answered.csv")

tf_dict = dict(size=14, family='Courier', color='Blue')

st.header("Users With Maximum Trivia Questions Answered (Multiple Sessions)")
fig = px.bar(df, x="user_id", y="nooftriviaquestionanswered",)
fig.update_xaxes(title_text="User ID", title_font=tf_dict)
fig.update_yaxes(title_text="Trivia Questions Answered", title_font=tf_dict)
st.plotly_chart(fig)Users by number of trivia questions answered
The visualization presents a breakdown of users distribution into different categories based on the number of trivia questions answered.
python
import streamlit as st
import pandas as pd
import plotly.express as px

df = pd.read_csv("UsersCount_Trivia_Answered.csv")

st.header("Users By Number Of Trivia Questions Answered")
fig = px.bar(df, x="no_of_trivia_question_answered", y="number_of_users",)
fig.update_xaxes(title_text="Number of Trivia Questions Answered",
                 title_font=dict(size=14, family='Courier', color='Blue'))
fig.update_yaxes(title_text="Users Count", title_font=dict(
    size=14, family='Courier', color='Blue'))
st.plotly_chart(fig)